
The files for this tutorial are available on github.com/ac2cz/SDR
The Python files are on github.com/ac2cz/pySdr though they are only partially complete for this tutorial.
In this second tutorial I am going to grab some sound from the sound card. We are going to use this data to better understand the FFT and how it looks with real data. This is going to take us some time because we need to make sure our code is working at each stage. So let's start by cheating. Rather than writing the code needed to open a sound card, let's record some audio and use that to test we can read and process audio correctly. This will have the added benefit of showing us how similar these two processes are. We will find it very useful in the future to be able to switch between recorded audio and live audio.
Here we introduce our first test tool, Audacity. If you do not already have Audacity installed, then install it now. It is a fabulous audio analysis tool and we will use it frequently. I will also keep a list of useful test tools on the Index page, with their download links.
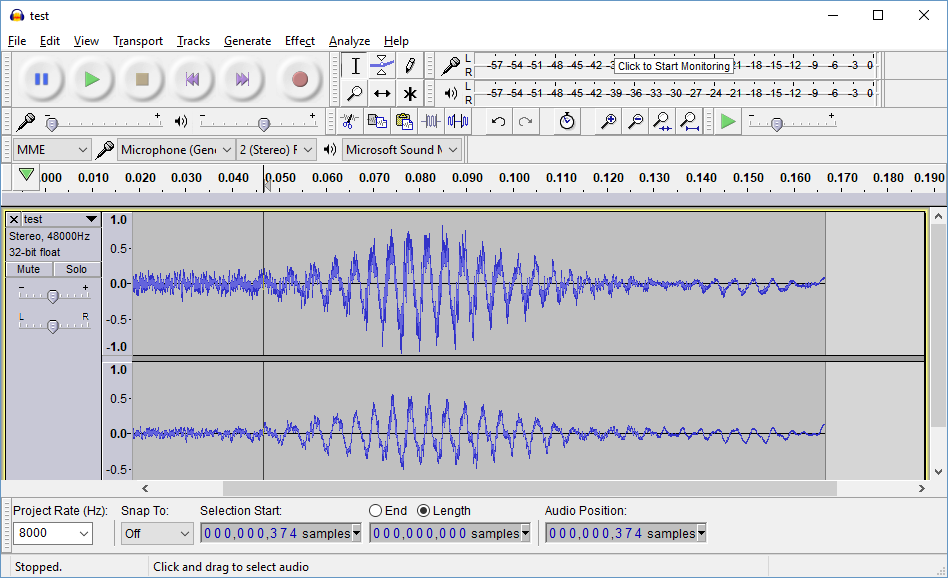
Once Audacity is installed, you can pick the sound card source from the pull down list to the right of the microphone. I picked the actual microphone on my laptop. Then press the red record button. For a test sound I coughed. I know that sounds crazy, but it created a nice distinct waveform, as shown in the screen shot to the right.
Next I shortened the audio clip. This is very easy in Audacity. Just click and drag the mouse to highlight the part of the waveform you do not want, then press the "Cut" icon which has a pair of scissors on it and is in the middle of the tool bar. We want 0.2 seconds of audio or less. To keep everything manageable we will also set the "Project Rate" in the bottom left to 8000. This means we will store things at 8000 samples per second.
Finally we select File > Export Audio and choose a wav file name. Save it in a directory that you can find again from your program. I save mine in the root directory of the Eclipse project. That is the directory that Eclipse runs the program from. You can also save it into another directory and pass the full path to your program.
Let's now write a new class that reads data from a wav file. If this all seems a bit abstract compared to reading data directly from the sound card, then bear with me. The wav file class is a stepping stone to reading from the soundcard. The final code will be very similar but more importantly we will be able to swap between the sound card or a wav file during our testing to confirm that everything is working in a much more controlled way.
Below is our wav file class. It has one constructor, which takes the filename and a buffer size as parameters. We also have two methods. One method reads data from the file and the other closes the audio stream.
The constructor is easy enough. It sets up an input and output buffer which we will use to source and process the bytes from the file. It then opens the audio stream and prints some debug information.
import wave

class Wavfile:

    def __init__(self, filename, samples):
        self.CHUNK = samples
        self.out = [0] * samples
        self.wf = wave.open(filename, 'rb')

        print ('Wavefile: Width:', self.wf.getsampwidth(),
               "Channels:",self.wf.getnchannels(), "Rate:",self.wf.getframerate())

    def read(self):
        read_buffer = self.wf.readframes(self.CHUNK)
        if len(read_buffer) == 0:
            return []
        get_doubles_from_bytes(self.out, read_buffer)
        return self.out

    def close(self):
self.wf.close()Our Java class is stored in WavFile.java.
You will notice that our constructor and read method throws some exceptions. Exceptions are the way that Java handles errors. These are thrown by the audio classes. In our test program we will throw them from each method right to the top of the program. So for now we won't handle them, but we will see the errors printed out when we run our program.
package tutorial2.audio;

import java.io.File;
import java.io.IOException;
import javax.sound.sampled.AudioInputStream;
import javax.sound.sampled.AudioSystem;
import javax.sound.sampled.UnsupportedAudioFileException;
import tutorial2.signal.Tools;

public class WavFile {

	AudioInputStream audioStream = null; // The stream of data from the wave file
	byte[] readBuffer;
	double[] out;

	public WavFile(String fileName, int samples) throws UnsupportedAudioFileException, IOException {
		readBuffer = new byte[samples * 4];
		out = new double[readBuffer.length / 4];
		File soundFile = new File(fileName);
		audioStream = AudioSystem.getAudioInputStream(soundFile);
		System.out.println("Wavefile: " + fileName);
		System.out.println("Format: " + audioStream.getFormat());
	}

	public double[] read() throws IOException {
		if (audioStream == null || !(audioStream.available() > 0) )
			return null;
		audioStream.read(readBuffer, 0, readBuffer.length);
		Tools.getDoublesFromBytes(out, readBuffer);
		return out;
	}

	public void close() {
		try {
			audioStream.close();
		} catch (IOException e) {
			e.printStackTrace();
		}
	}
}
In our classes above, the read method is the only bit of complexity. The good news is this complexity will be the same method for the sound card. So if we get it right here we can reuse it for our sound card read method.
The complexity comes from the audio format and the format that we want to use internally in our program. We want our audio to look like a set of doubles, where each double is a point in the audio stream, just as it was in Tutorial One. The problem is that the format of the sound data we read from the operating system is stored as two bytes for each sample. We also have two stereo chanels, so four bytes for each sample point. We have read the format from the wav file in the constructor and we print it out as Debug Information. In the Java case it tells us the following (Python output is similar):
  Wavefile: test_sound.wav
  Format: PCM_SIGNED 8000.0 Hz, 16 bit, stereo, 4 bytes/frame, little-endian
Armed with that information we implement a method to process the data and extract one channel as a set of doubles.
We put these conversion routines in our Audio module together with our Wavfile class. Python experts will be able to implement these with a single line, or perhaps two. This code is written for clarity rather than compactness. I tried not to use unfamilar Python functions.
def little_endian2(b1,b2):
    value =  ((b2 & 0xff) << 8)| ((b1 & 0xff) << 0)
    if (int(value) > int(2**15-1)):
        value = int((-1*2**16) + value)
    return value

def get_doubles_from_bytes(out, read_buffer):
    # 4 bytes for each sample. 2 in each stereo channel
    for i in range(0, int(len(read_buffer)/4)):
        d =  little_endian2(read_buffer[4*i],read_buffer[4*i+1])
        d = d /32768.0
out[i] = dIn Java we store this code in a class we call Tools, which is part of our signal package. We put this in a different class so we can reuse it elsewhere in the program. Our methods are declared static, so we can reference them without creating an instance of Tools.
We could also have reused it by having a parent class for our WavFile and future SoundCard classes. (Note to Java experts that you can also implement this with a ByteBuffer).
package tutorial2.signal;

public class Tools {

	public static int littleEndian2(byte b[], int bitsPerSample) {
		byte b1 = b[0];
		byte b2 = b[1];
		int value =  ((b2 & 0xff) << 8)
		     | ((b1 & 0xff) << 0);
		if (value > (Math.pow(2,bitsPerSample-1)-1))
			value = (int) (-1*Math.pow(2,bitsPerSample) + value);
		return value;
	}

	public static void getDoublesFromBytes(double[]out, byte[] readBuffer) {
		for (int i = 0; i < out.length; i++) {// 4 bytes for each sample. 2 in each stereo channel.
			byte[] ab = {readBuffer[4*i],readBuffer[4*i+1]};
			double value =  Tools.littleEndian2(ab,16);
			value = value /32768.0;
			out[i] = value;
		}
	}
}
The first function converts bytes into doubles. It loops over the output buffer and takes every 4th/5th byte from the input. That processes bytes 0,1 then 4,5, then 8,9. It gives us one of the stereo channels. We use a sub-routine to convert the two bytes into a signed 16 bit value. A 16 bit number can be recreated from two bytes by shifting one byte 8 bits to the left and then or-ing it with the other byte. We shift the second byte, because in a little-endian format the lower value byte is first.
Let's print the data out that we have read and graph it again. This is why we picked a small clip of audio with a distinctive shape. If everything is working as expected then we should see exactly the same shape when we graph it. If our loop counter is off, or our doubles conversion is not working, then it will be a mess. But we will be able to debug it.
The program needs a main method and is something like the following.
I've shown the whole Python program, though you can also temporarily add this main function to your Audio module to test it. Then you would not need the import Audio statement.
import audio

def main():
    wf = audio.Wavfile("test_sound.wav", 128)
    reading_data = True

    while reading_data:
        data = wf.read()
        if len(data) > 0:
            for d in data:
                print(d)
        else:
            reading_data = False

main()
	public class Tut2Main1 {

	public static void main(String[] args) throws UnsupportedAudioFileException, IOException {
		WavFile wavfile = new WavFile("test_sound.wav",128);
		boolean readingData = true;

		while (readingData) {
			double[] buffer = wavfile.read();
			if (buffer != null) {
				for (double d : buffer)
					System.out.println(d);
			} else
				readingData = false;
		}
		wavfile.close();
	}
If you run this and get an error like the below, then it could not find the file that you specified. This looks very complicated, but it actually tells us a lot. If we look on the last line we see at was caused by line 10 in WavTutorial2.java, and in the WavTutorial2.main methid. This is the line that tries to open the wav file. We can see on the line above that that the error was passed back up through the init method in WavFile, which is the constructor. It tells us line 20. The actual error is printed on the first line.
Exception in thread "main" java.io.FileNotFoundException: tst_sound.wav (The system cannot find the file specified)
	at java.io.FileInputStream.open0(Native Method)
	at java.io.FileInputStream.open(Unknown Source)
	at java.io.FileInputStream.(Unknown Source)
	at com.sun.media.sound.WaveFloatFileReader.getAudioInputStream(Unknown Source)
	at javax.sound.sampled.AudioSystem.getAudioInputStream(Unknown Source)
	at tutorial2.audio.WavFile.(WavFile.java:20)
	at tutorial2.WavTutorial2.main(WavTutorial2.java:10)
After making sure the path to the wav file is correct, the program runs and the data prints to the terminal. If the listing is too long and you miss the start (you can not still see the file format printed out) then run this from the command line and redirect into a file. You can also add a comma to the output so this makes a csv file, which loads directly into most spreadsheets.
I just copy and paste the whole output into Excel, then while the pasted data is still highlighted I use Insert > Scatter with Straight Lines and Markers. If everything is working we get the following:
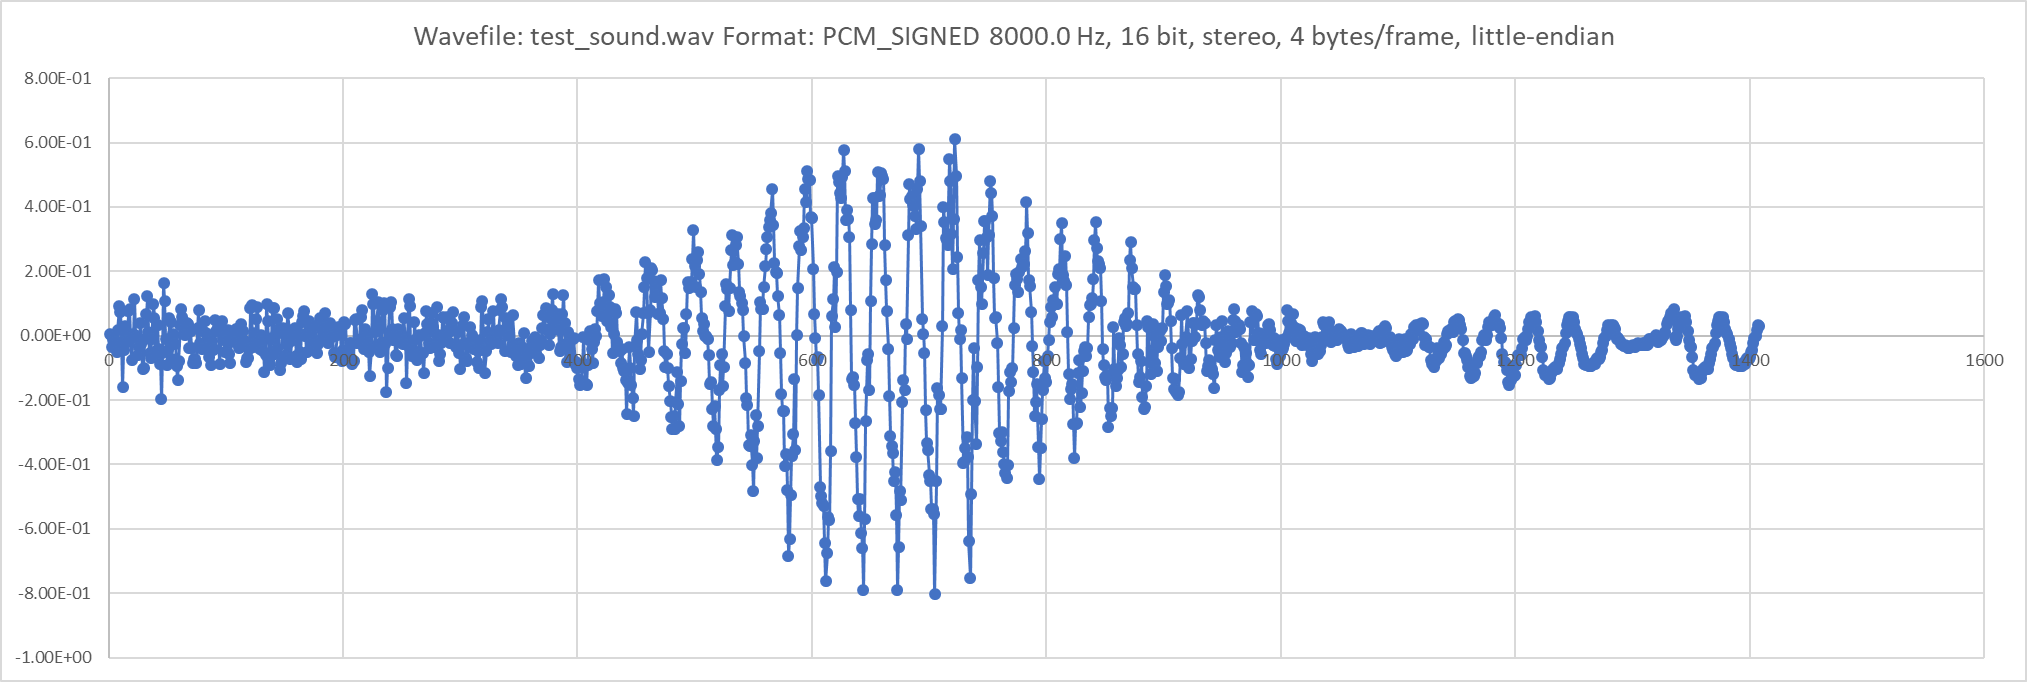
If we have the above graph then the code is working. We know we have a rock solid routine for sourcing audio and converting it to Doubles. Truthfully, even as I was writing this tutorial the graph did not come out correctly. I had an error in the loop that converted the bytes to doubles. I was converting every second and third byte instead of every forth and fifth. The plot looked mostly correct, but just slightly wrong. I was plotting both stereo channels at the same time. You may also get convincing looking audio but it does not quite match. Make sure that you set Audacity to 8000 samples per second. Otherwise you will have a really large output and you may not be able to graph it all.
I promised we would read data from the sound card. The good news is we just need to create a new "audio source" to replace our wav file. It will have a very similar read method that returns doubles. But first, let's introduce a new test tool. We will create a line graph to show our results real time on the screen. We will call it LineChart. We will need this once we have real time audio coming in from the sound card.
This is not DSP code, but we do need to be able to display results to the user. We include some code to automatically scales the data into the window, but otherwise it does nothing other than calculate the points and draw the lines. It looks long, but this is GUI rather than DSP code and it always seems to take a lot of lines.
So here is the class for our LineChart, which goes in a new package called plot and is called LineChart.java:
All of our user interface will use the Java Swing widgets. LineChart will be a JPanel, a widget that we can display anywhere in our final program. It will have one method "setData" which when called with an array of doubles will plot them on the screen.
The bulk of the work in this class is done by the "paintComponent" method, which overrides the same method in the parent JPanel class. We use it to draw the graph directly on the JPanel.
package tutorial2.plot;

import java.awt.Graphics;
import java.awt.Graphics2D;
import javax.swing.JPanel;

@SuppressWarnings("serial")
public class LineChart extends JPanel {

	double[] data;
	public static final int BORDER = 30;

	public LineChart(String chartTitle) {

	}
	public LineChart(String chartTitle, double[] data) {
		this.data = data;
	}

	public void setData(double[] data) {
		this.data = data;
		repaint();
	}

	public void paintComponent(Graphics gr) {
		super.paintComponent( gr ); // call superclass's paintComponent
		Graphics2D g2 = (Graphics2D) gr;

		double maxValue = -99999;
		double minValue = 99999;
		for (int n=0; n < data.length; n++) {
			if (data[n] > maxValue) maxValue = data[n];
			if (data[n] < minValue) minValue = data[n];
		}
		gr.drawLine(BORDER, getHeight()-BORDER, BORDER, BORDER);

		// The zero point is the middle of the JPanel.  We have aqn equal BORDER top and bottom.
		int zeroPoint = getHeight()/2;
		gr.drawLine(BORDER, zeroPoint, getWidth()-BORDER, zeroPoint);

		int step = data.length / 16; // plot 16 labels
		int lastx = BORDER, lasty = zeroPoint;

		for (int n=0; n < data.length; n++) {
			// We have values from -1 to 1.  We want to scale them so that +1 is the top of the
			// JPanel and -1 is the bottom.  The top is at x position BORDER.  The bottom is at
			// X position getHeight()-BORDER
			int y = getRatioPosition(minValue, maxValue, data[n], getHeight()-BORDER*2);
			int x = getRatioPosition(data.length,0,n,getWidth()-BORDER*2);
			x = x + BORDER;
			gr.drawLine(lastx, lasty, x, y);
			lastx = x;
			lasty = y;
			if (n % step == 0)
				g2.drawString(""+n, x, zeroPoint+15);
		}
	}

	public static int getRatioPosition(double min, double max, double value, int dimension) {
		if (max == min) return 0;
		double ratio = (max - value) / (max - min);
		int position = (int)Math.round(dimension * ratio);
		return position;
	}
}
To display the JPanel we need to pop a window up on the screen. In Java Swing that is a JFrame. We use a short class that extends JFrame and will be our window. It has one method that allows data to be set. It simply sets (or updates) the data in the LineChart.
package tutorial2;

import javax.swing.JFrame;
import tutorial2.plot.LineChart;

@SuppressWarnings("serial")
public class MainWindow extends JFrame {

	LineChart lineChart;

	public MainWindow(String title) {
		super(title);
		this.setDefaultCloseOperation(EXIT_ON_CLOSE);
		setBounds(100, 100, 740, 400);
		lineChart = new LineChart("DSP Results");
		add(lineChart);
	}

	public void setData(double[] data) {
		lineChart.setData(data);
	}
}
Does our LineChar work? That's a good question. Let's run the same test wav file into this to see if we get the same waveform displayed. We write a short main method like this:
	public static void main(String[] args) throws UnsupportedAudioFileException, IOException {

		MainWindow window = new MainWindow("Test Tool");

		WavFile wavfile = new WavFile("test_sound.wav", 1500);
		boolean readingData = true;

		while (readingData) {
			double[] buffer = wavfile.read();
			if (buffer != null) {
				window.setData(buffer);
				window.setVisible(true);
			} else
				readingData = false;
		}
		wavfile.close();
	}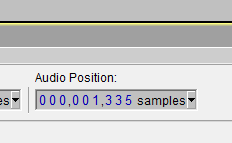
To run this we need to make sure that the wavfile.read() method loads the whole file in one go. This allows us to plot it without changing our code too much. We can calculate how long the file is approximately or we can check how long the file is by opening it in Audacity again. My file is about 1300 samples long, so I set the WavFile to load 1500 samples per read. That should be the whole file.
To check the length of the file in Audacity, click at the end of the audacity file. The samples are shown in a box in the middle of the bottom of the window called "Audio Position". If it is not displaying "samples", as shown in the picture to the left, then change the pull down to samples. (Note if Audacity zooms the window rather than changes the position when you click, then you need to change the selection tool, which is in the middle of the top toolbar. Pick the Vertical Bar symbol).
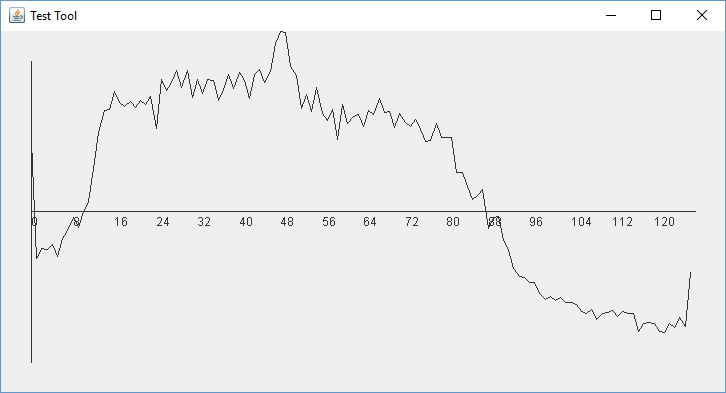
With that done, we run the program and we should have a window pop up and display something like the below. If we do not, then we have some debugging to do! Again we know exactly what the output should be so we can work on this until we have a reliable tool to display the data we read in.
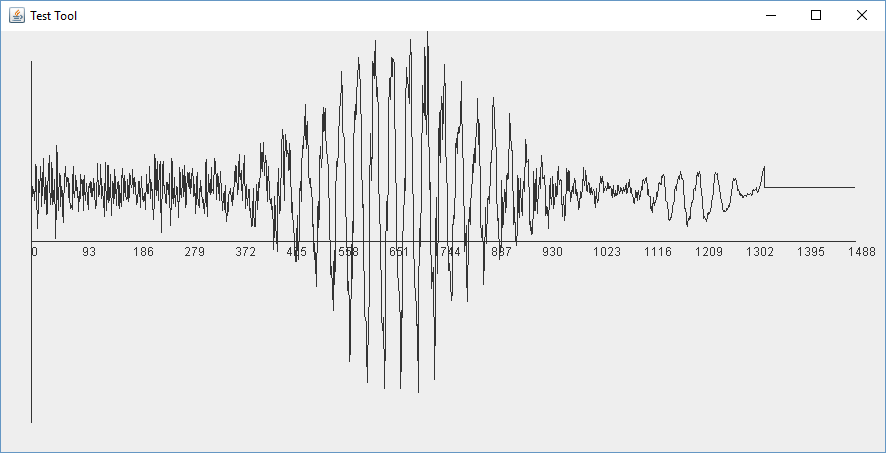
Ok, we have made good progress with a new test tool - our LineChart. We know that it works because we know the shape of the audio in our file and we have plotted it correctly. Now we just need the routine to read from the sound card directly.
This Soundcard class will be a drop in replacement for the Wavfile class from before. In fact we will be able to swap from one to the other to test that things are working, or to play back recordings of test data that we make.
While the SoundCard class looks very similar to WavFile, there are two key differences. Firstly we create the format we want rather than read it from the file. Secondly we ask the Audio system for a sound card with that format. It will give us the default sound card assuming it supports that format. You can set your default sound card in your operating system settings. In Windows you go to "Manage Audio Devices" from settings or the Control Panel and on the "Playback" tab make sure that the default device is the one you want. Otherwise select it and click "Set Default". Our SDR will need to let us pick the sound card, but for our first test, this will do nicely.
package tutorial2.audio;

import javax.sound.sampled.AudioFormat;
import javax.sound.sampled.AudioSystem;
import javax.sound.sampled.DataLine;
import javax.sound.sampled.LineUnavailableException;
import javax.sound.sampled.TargetDataLine;
import tutorial2.signal.Tools;

public class SoundCard {

	AudioFormat audioFormat;
	TargetDataLine targetDataLine;
	byte[] readBuffer;
	double[] out;

	public SoundCard(int sampleRate, int samples) throws LineUnavailableException {
		readBuffer = new byte[samples * 4];
		out = new double[readBuffer.length / 4];
		audioFormat = getAudioFormat(sampleRate);
		System.out.println("Source Format: " + audioFormat);
		DataLine.Info dataLineInfo = new DataLine.Info(TargetDataLine.class, audioFormat);
		targetDataLine = (TargetDataLine) AudioSystem.getLine(dataLineInfo);
		targetDataLine.open(audioFormat);
		targetDataLine.start();
	}

	public double[] read() {
		targetDataLine.read(readBuffer, 0, readBuffer.length);
		Tools.getDoublesFromBytes(out, readBuffer);
		return out;
	}

	public void stop() {
		targetDataLine.stop();
		targetDataLine.close();
	}

	private AudioFormat getAudioFormat(int sampleRate) {
		int sampleSizeInBits = 16;
		int channels = 2;
		boolean signed = true;
		boolean bigEndian = false;
		AudioFormat af = new AudioFormat(sampleRate,sampleSizeInBits,channels,signed,bigEndian);
		return af;
	}
}To analyze our audio, we could plot it directly with our line chart. That would be nice and I encourage you to try that. I am going to reuse our FFT code from Tutorial 1 but rather than graphing it in a spreadsheet I will display that in our LineChart. Let's show the listing and then explain it.
		public static void main(String[] args) throws UnsupportedAudioFileException,
	IOException, LineUnavailableException {
		int sampleRate = 8000;
		int len = 256;
		//WavFile soundCard = new WavFile("cw_signals.wav", len);
		SoundCard soundCard = new SoundCard(sampleRate, len);
		MainWindow window = new MainWindow("Test Tool");

		double[] psdBuffer = new double[len/2];
		double binBandwidth = sampleRate/len;
		boolean readingData = true;
		int averageNum = 10;

		while (readingData) {
			double[] buffer = soundCard.read();
			if (buffer != null) {

				DoubleFFT_1D fft;
				fft = new DoubleFFT_1D(len);

				fft.realForward(buffer);
				double psd = Tools.psd(buffer[0],buffer[0], binBandwidth);
				psdBuffer[0] = Tools.average(psdBuffer[0],psd, averageNum); // bin 0
				for (int k=1; k<len/2; k++) {
					psd = Tools.psd(buffer[2*k],buffer[2*k+1], binBandwidth);
					psdBuffer[k] = Tools.average(psdBuffer[k],psd, averageNum); // bin k
				}
				// finally deal with bin n/2
				psd = Tools.psd(buffer[1],buffer[len/2],binBandwidth);
				psdBuffer[len/2-1] = Tools.average(psdBuffer[len/2-1],psd, averageNum);

				window.setData(psdBuffer);
				window.setVisible(true); // causes window to be redrawn
			} else
				readingData = false;
		}
	}
Note that we have put in lines for both the soundcard and the wavfile. By commenting out one or the other, you can change where your test data comes from. Also note that when you play back a wav file, it will rattle through at top speed. You can slow things down by adding a sleep statement. Just add the following line somewhere in the loop and add InterruptedException to the list of Exceptions thrown by main():
Thread.sleep(30);
We have also added in a slightly new way to display the results of the FFT. Rather than just plotting the magnitude of the signal, we plot the Power Spectral Density (PSD) on a log scale. To do this we calculate our magnitude as in Tutorial 1 but then we divide the value by the bin bandwidth and take the log of the value. This log scale works much better with the large variation in values that we will get back from the FFT.
We also introduce a running average routine. It turns out that plotting one FFT result after another is very noisy. If we average the values then we can clearly see the signals. Averaging is a form of low pass filtering so this is our first digital filter. I encourage you to try the code with and without the averaging and with and without the Power Spectral Density calculation, to see what happens.
These two new functions have been added to the Tools class and look like this:
	public static double average (double avg, double new_sample, int N) {
		avg -= avg / N;
		avg += new_sample / N;
		return avg;
	}

	public static double psd(double re, double im, double binBandwidth) {
		return (20*Math.log10(Math.sqrt((re*re) + (im*im))/binBandwidth));
	}
Ok. That is quite a lot of code and complexity. In my Java Tutorial I explained how to compile Tutorial 1. Let me give some more notes here to compile this Tutorial.
If you have been following along you should have these files and if you put them in the same Java packages as I did (which is not required) then they will be in sub-folders as follows:
signal/Tools.java
signal/Oscillator.java
plot/LineChart.java
source/WavFile.java
source/Soundcard.java
SdrTutorial2.java
If you are using an IDE and have the JTransforms jar file added to the classpath then you should be able to compile and run it.
If you are running from the command line then you will need to run javac for each file with a classpath that includes JTransforms. A simple batch file like this works:
@echo off
echo Building SDR Java
set path=%path%;C:\Program Files\Java\jdk1.8.0_144\bin
set CLASSPATH=.;C:\Users\chris\Desktop\workspace\Sdr\lib\jtransforms\JTransforms-3.1-with-dependencies.jar
javac tutorial2\signal\Tools.java
javac tutorial2\signal\Oscillator.java
javac tutorial2\plot\LineChart.java
javac tutorial2\source\WavFile.java
javac tutorial2\source\Soundcard.java
javac tutorial2\Tut2Main3.java
You can then run this with a single command
java tutorial2/SdrTutorial2
With the code compiled I plugged an audio cable into my Elecraft K2 and fed it into the default soundcard. You don't need a fancy audio interface. Just a stereo audio cable. I tuned it to 7030kHz, which is a busy part of the CW band on 40 meters and ran the program. This is what we get!
So our receiver pass band is from 12 * 31.25 = 375Hz to 2500Hz, which sounds right. I can click the Filter width button on my transceiver and see the width change in real time. Pretty cool.
And the CQ station is calling centered on bin 47, which is at 47 * 31.25 = 1469Hz.
You can play around with the code to see what happens as you change the size of the FFT and the amount of averaging. They are both easy to update right in the main method. To change the averaging, modify the row "int averageNum = 10;" to another value and re-run the program. To change the length of the FFT modify the row "int len = 256;" and try other values. If you don't stick to even numbers then the psd calculation will be incorrect, but we have no scale, so what does that matter. Play around and see what you get.
One other thing to note. The length of the audio sample and the size of the FFT are the same. We don't want that sort of tight coupling. We are also running an FFT every time we grab a buffer, that is probably more FFTs than we want to run if this is just a display of the spectrum for the user. We will fix these issues in our SDR when we introduce a circular buffer to store the captured audio. More on that later.
That is probably enough for this tutorial. You can perhaps already see where we are going to go from here. If we can read audio data from a sound card then we can read I and Q data from the hardware part of a Software Defined Radio. If we can read and process I/Q data then we can build our SDR. We will slide further into the weird and wonderful world of digital radio in next tutorial.
Prev Tutorial | Index | Next Tutorial
Enter Comments Here:
| On: 07/02/19 8:08 guillermo said: |
| Hi Chris! For starters, thanks a lot for the tutorials! They are really easy to follow even for a newbie in Java as I am. I've almost completed tutorial 2, but then when I try to build the main methos, just at the end of the tutorial, the lines containing Tools.psd and Tools.average produce a "cannot find symbol" in Netbeans. As a matter of fact I could'nt find those methods in the class Tools. Can you kindly provide the code for the aftermentioned methods? I thank you in advance and I thank you again for posting this great material. I am really excited with SDR and eager to proceed with tut 3. Best regards Guillermo (LU9AGA) |
| On: 07/02/19 9:09 Chris g0kla said: |
| Tools.average is defined in the last block of Java code. Search for "average" on the page and you should find it. It is just after the line that says "These two new functions have been added to the Tools class and look like this:" Make sure you have spelled it the same way. Capital or non capital letters matter too! Those have to be the same. |
| On: 07/02/19 10:10 guillermo said: |
| Thanks, Chris for your quick reply! In fact, I searched for "psd" and "average" but as that particular piece of code was collapsed, I did not find them. I was very excited to complete tut number 2 and I missed the collapsed Java code. My bad, anyway. By the way, I am encouraging my colleagues here in Buenos Aires to walk through your tutorial. It a great way to start learning DSP, and Java o Python at the same time. Thanks again and 73 to you! |
| On: 01/09/20 10:10 Claude KE6DXJ said: |
| Chris, thanks for your efforts in presenting these tutorials. The hands on approach is a useful adjunct to reading the theory. As I work through the tutorials, I hope you are able to maintain their presence on the web. My speed in working through the tutorials is unimpressive. The expense is not trivial. I have experimented some using javafx for the GUIs. You have my admiration for your contributions to mentoring in this interesting topic. |
| On: 01/09/20 14:14 Chris g0kla said: |
| Claude, good to hear from you and glad the tutorials are helpful. They will remain here for as long as people are interested, so take your time. Feel free to post here or to email me directly if you have questions. This stuff is fascinating but not always intuitive or easy. If you know JavaFX better than Swing, then everything should run fine from that Toolkit. I have a substantial historical investment in Swing, so it was easiest to use that. Both work well. |
Copyright 2001-2021 Chris Thompson
Send me an email